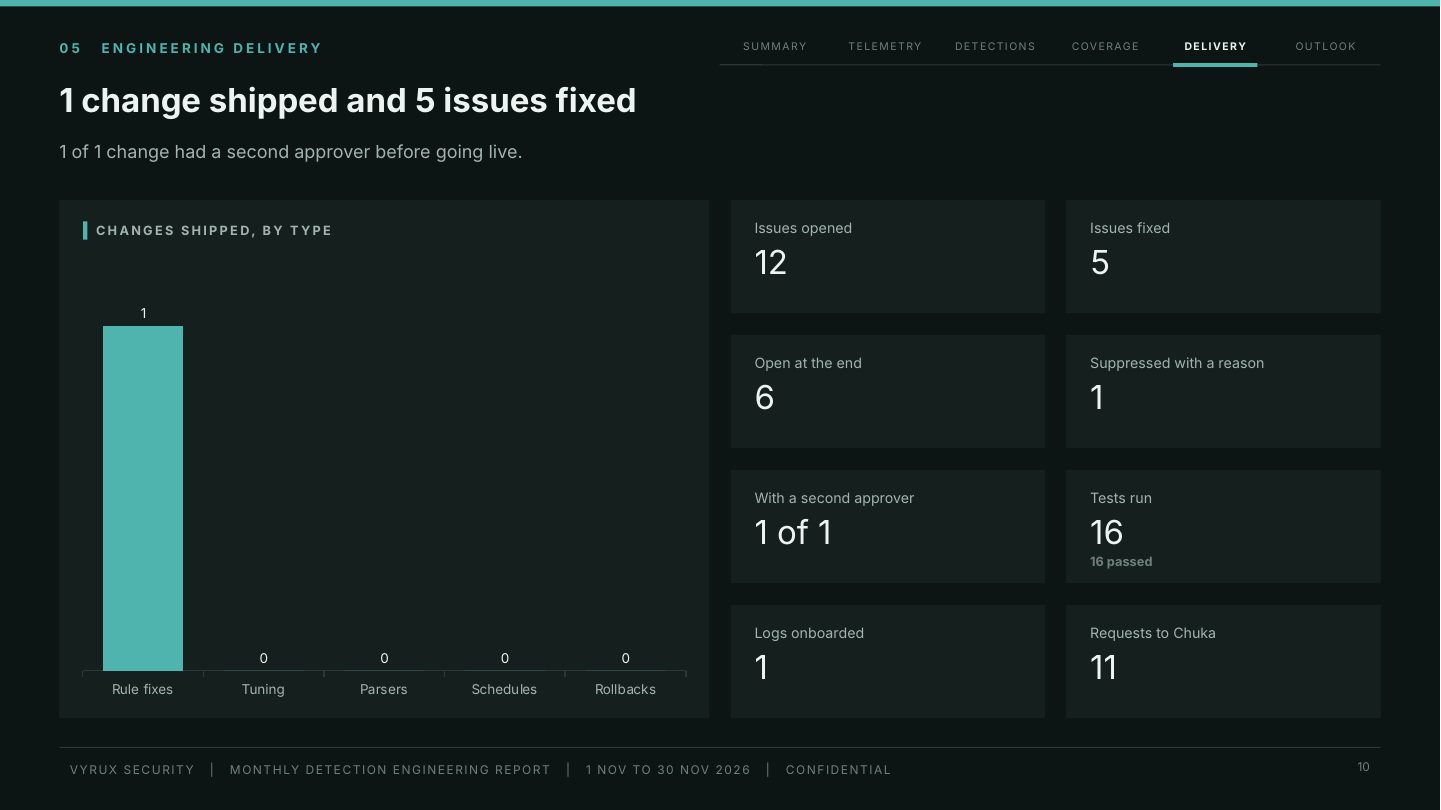
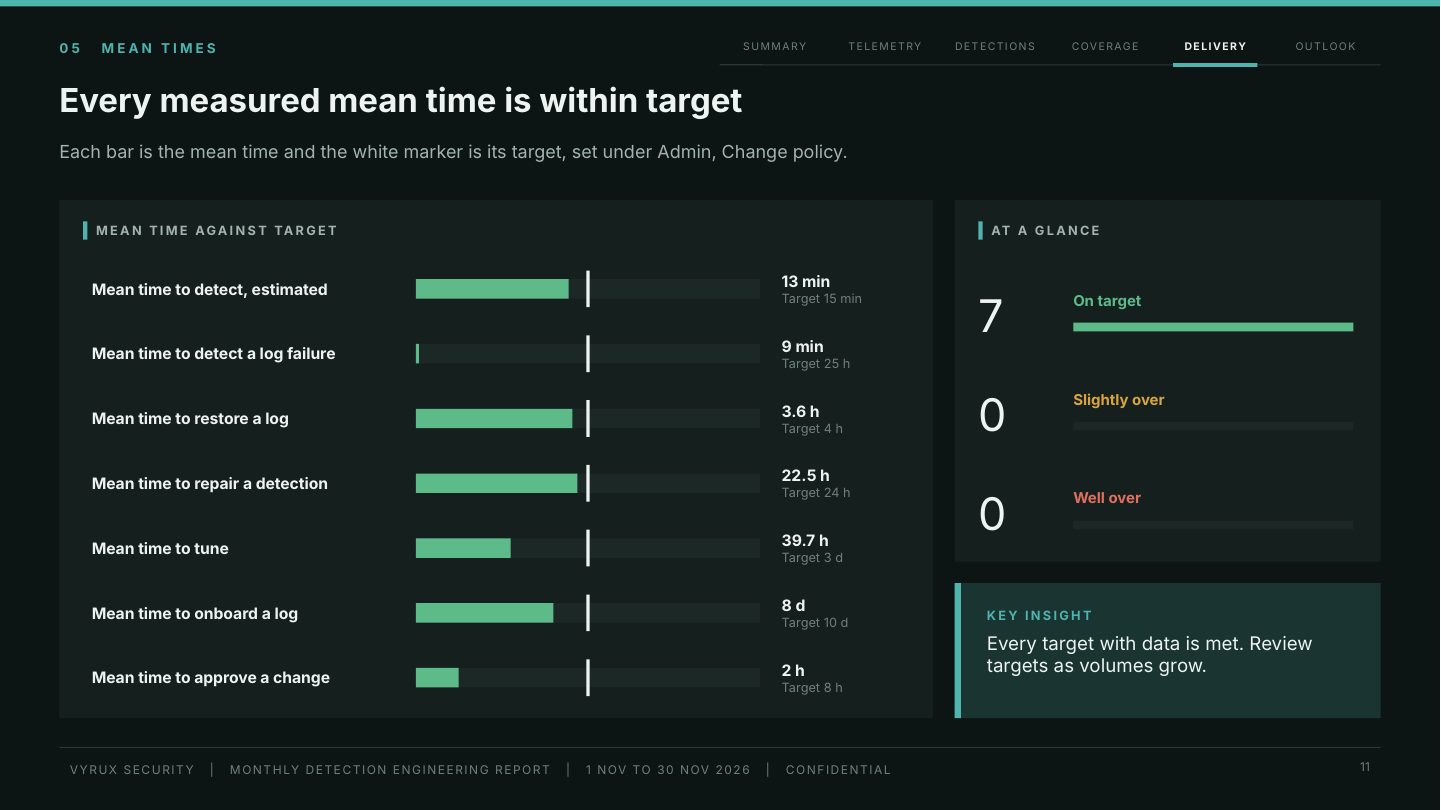
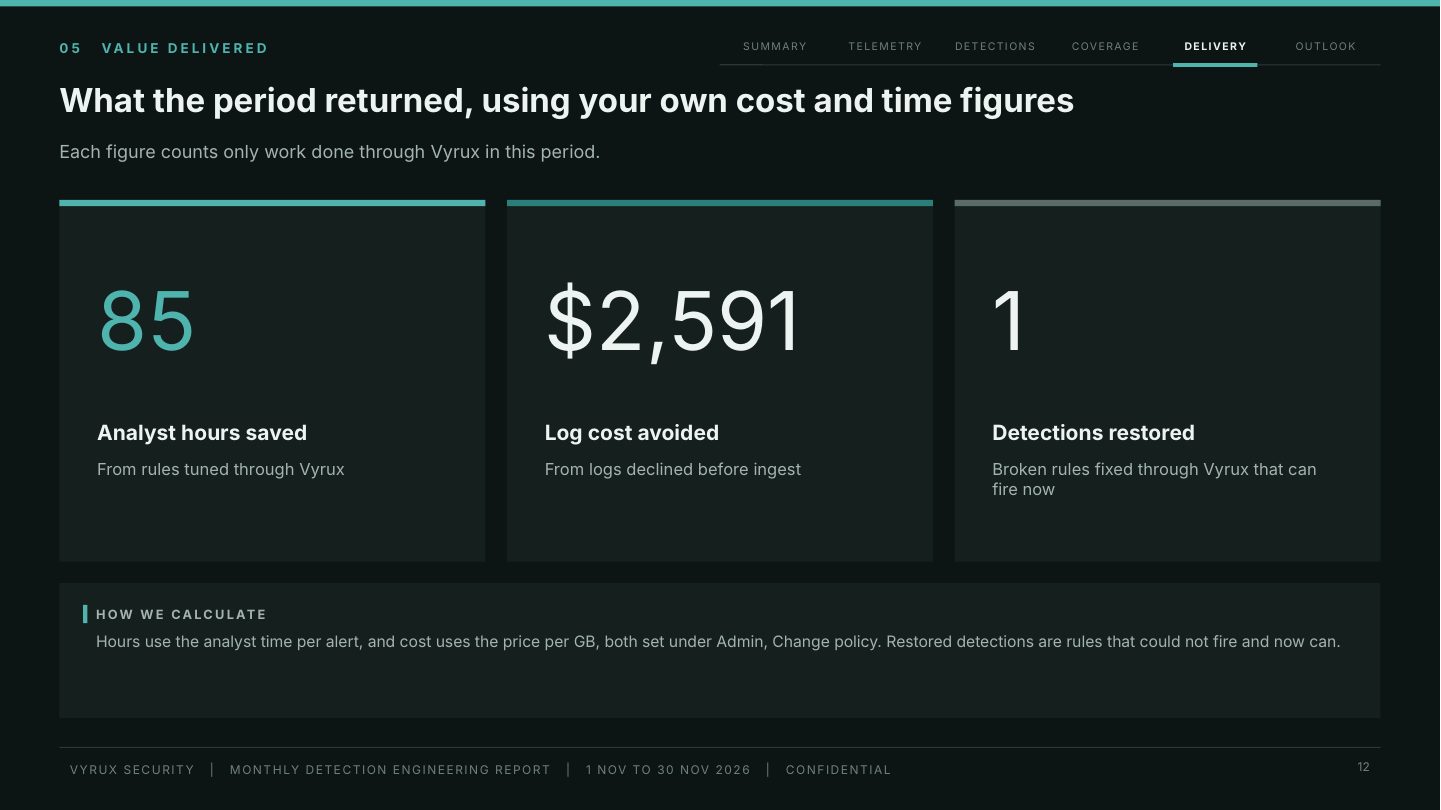
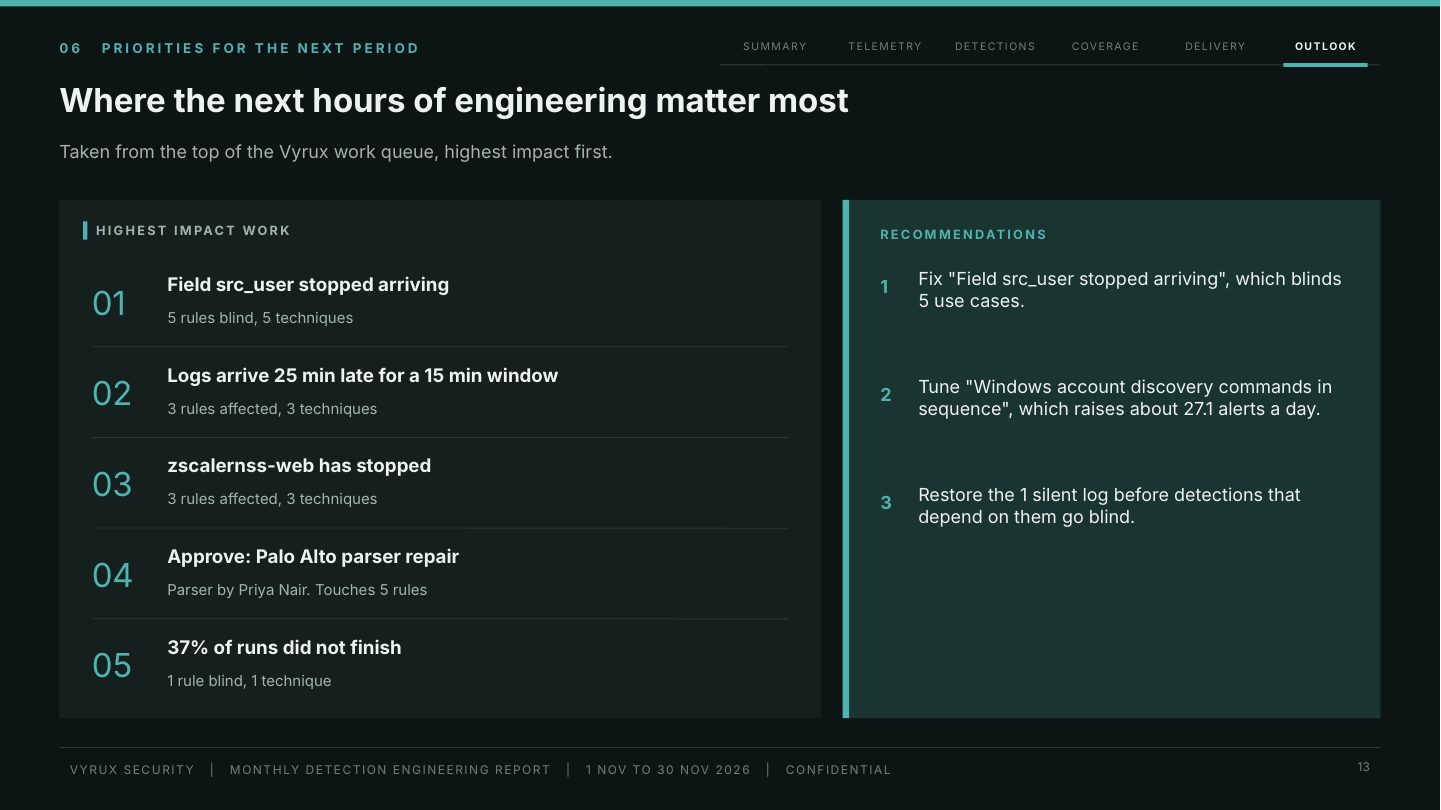
Detection Engineering Report decks
A Detection Engineering Report for every week, month, quarter and year, kept by year, each one downloadable as a PowerPoint deck in the Vyrux dark consulting style. Use them for the weekly SOC meeting, the monthly service review, the quarterly business review and the annual report to leadership.
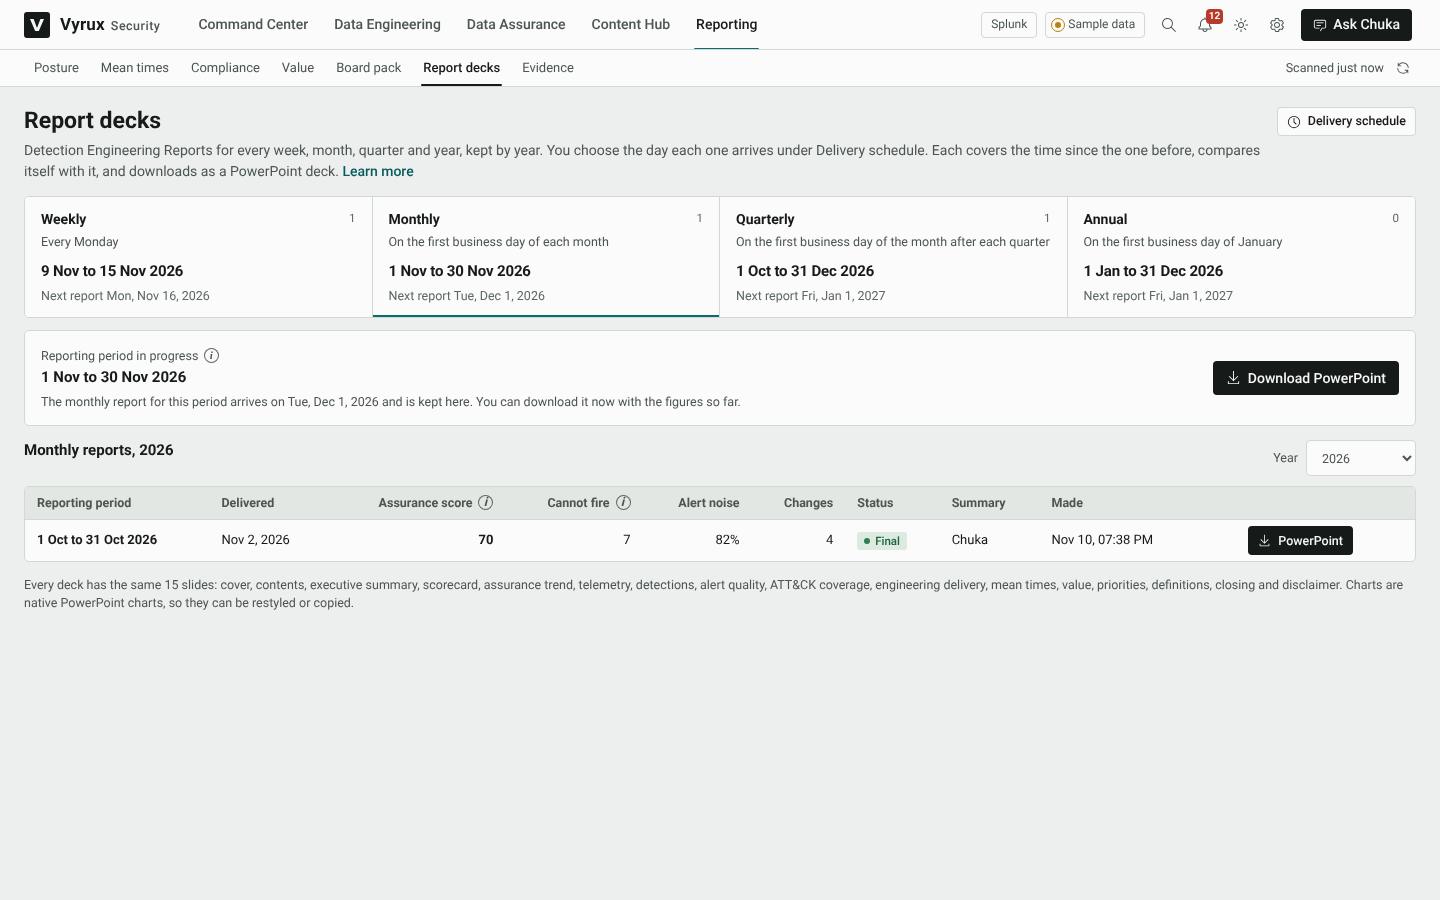
- Go to Reporting, Report decks.
- The four tiles at the top show each report: the day it arrives, the period it covers now, and when the next one is due. Click a tile to see its kept reports.
- Click PowerPoint on any report to download it. Hover a report and click the eye icon to read its summary and scorecard first.
- To share the current period before it ends, click Download PowerPoint under Reporting period in progress.
Choose when each report arrives
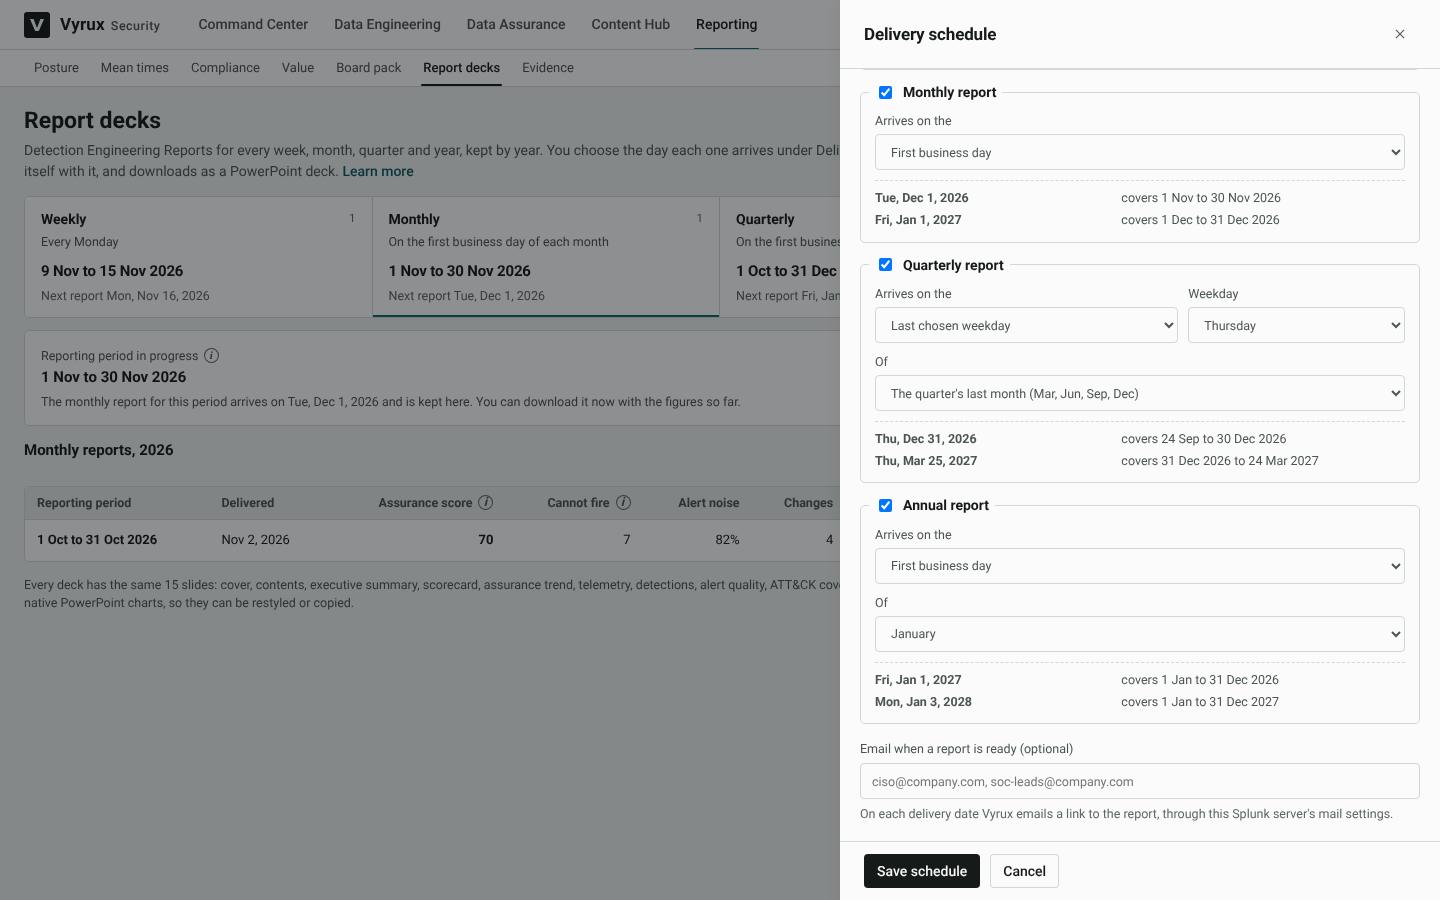
Click Delivery schedule and pick the day for each report. Under each choice Vyrux lists the next two delivery dates and exactly which dates each one covers, so everyone knows the reporting periods.
- Weekly: any weekday, such as every Monday.
- Monthly: the first business day, the last business day, a day of the month from the 1st to the 28th, or the first or last of a chosen weekday.
- Quarterly: the same choices, in the quarter's last month or the month after the quarter. For example, the last Thursday of the quarter.
- Annual: the same choices, in the month you pick.
A report covers everything since the one before it. First business day is special: it covers whole calendar months, quarters and years, and arrives on the first working day after. You can turn any report off, and add email addresses so Vyrux emails them a link on each delivery day. Reports already made are kept as they are.
How reports are made
- On the delivery day, the first person to open Vyrux makes the report. The figures are frozen then, so last month's report reads the same next year.
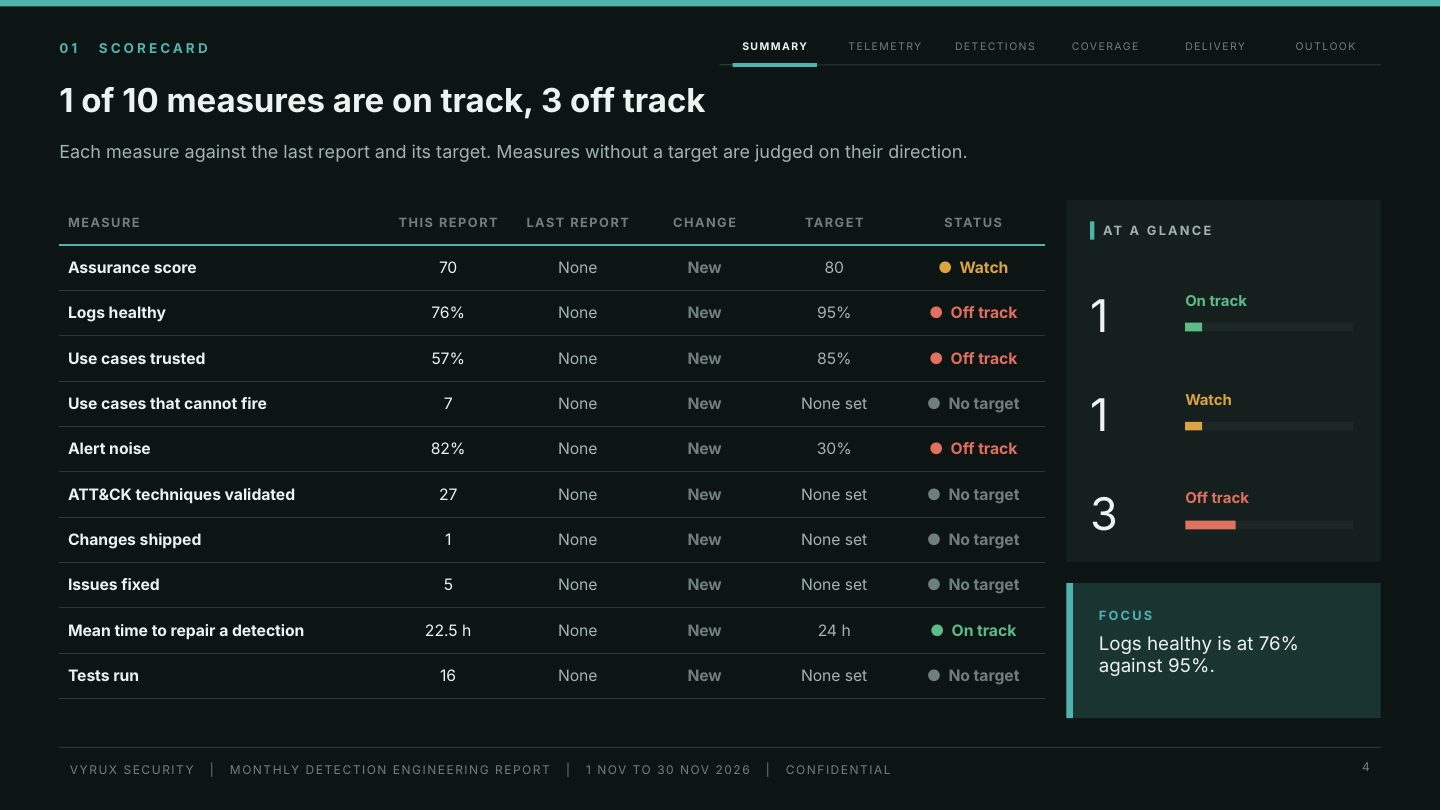
- Each report compares itself with the one before: every measure shows its change.
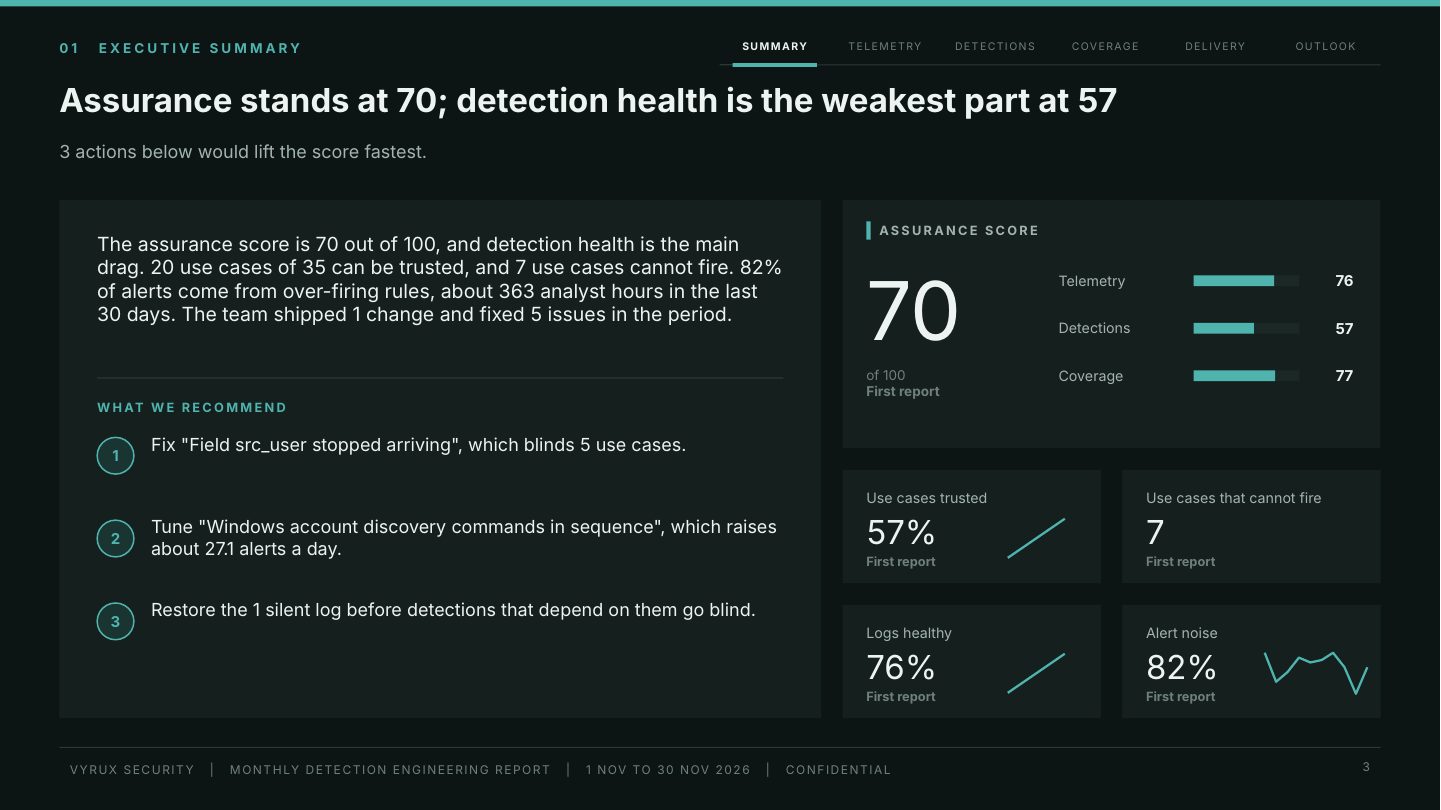
- Chuka writes the executive summary and three recommendations from the report's own figures, when AI is on. Without AI, Vyrux writes plain sentences from the same figures. You can ask Chuka to rewrite a kept summary at any time; the figures do not change.
What is in each deck
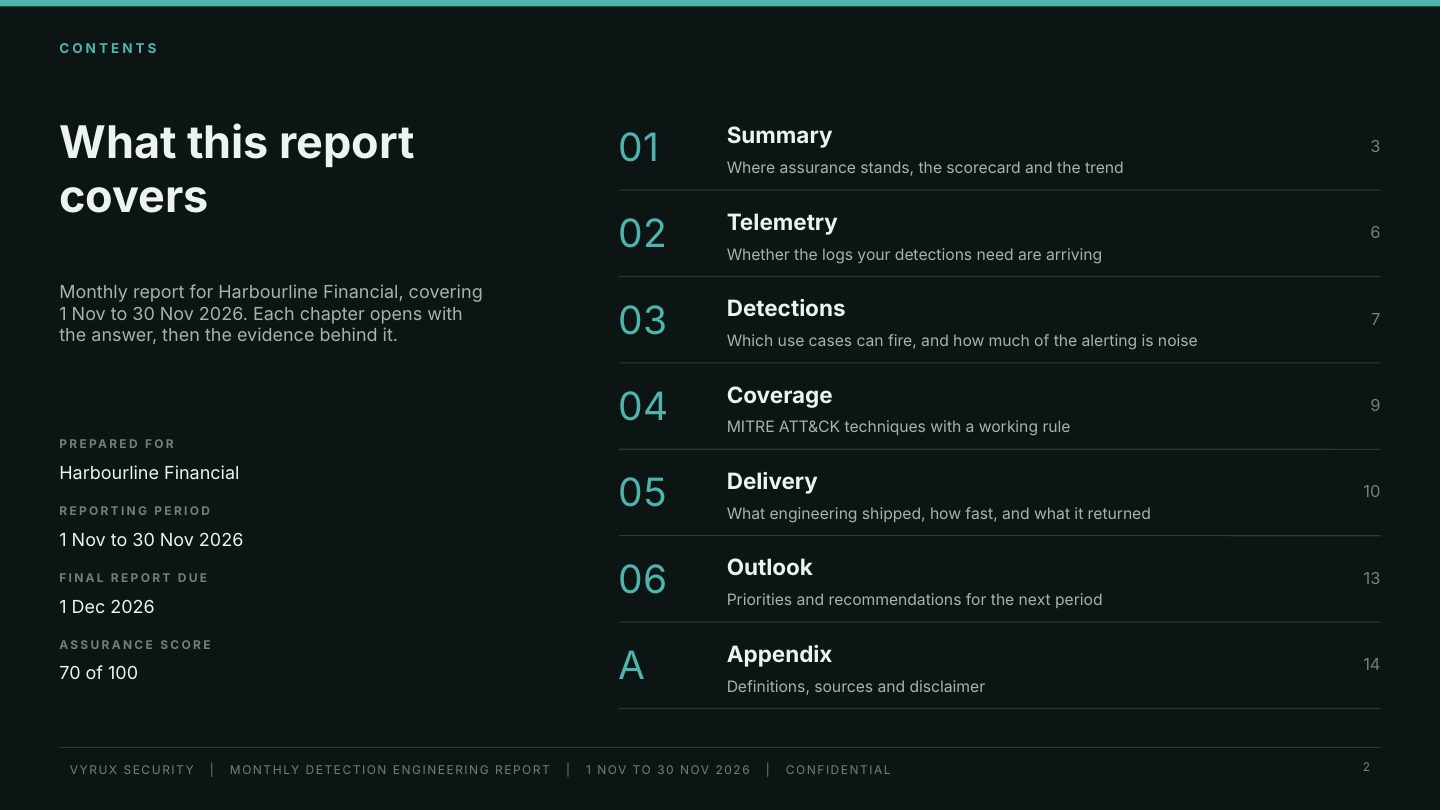
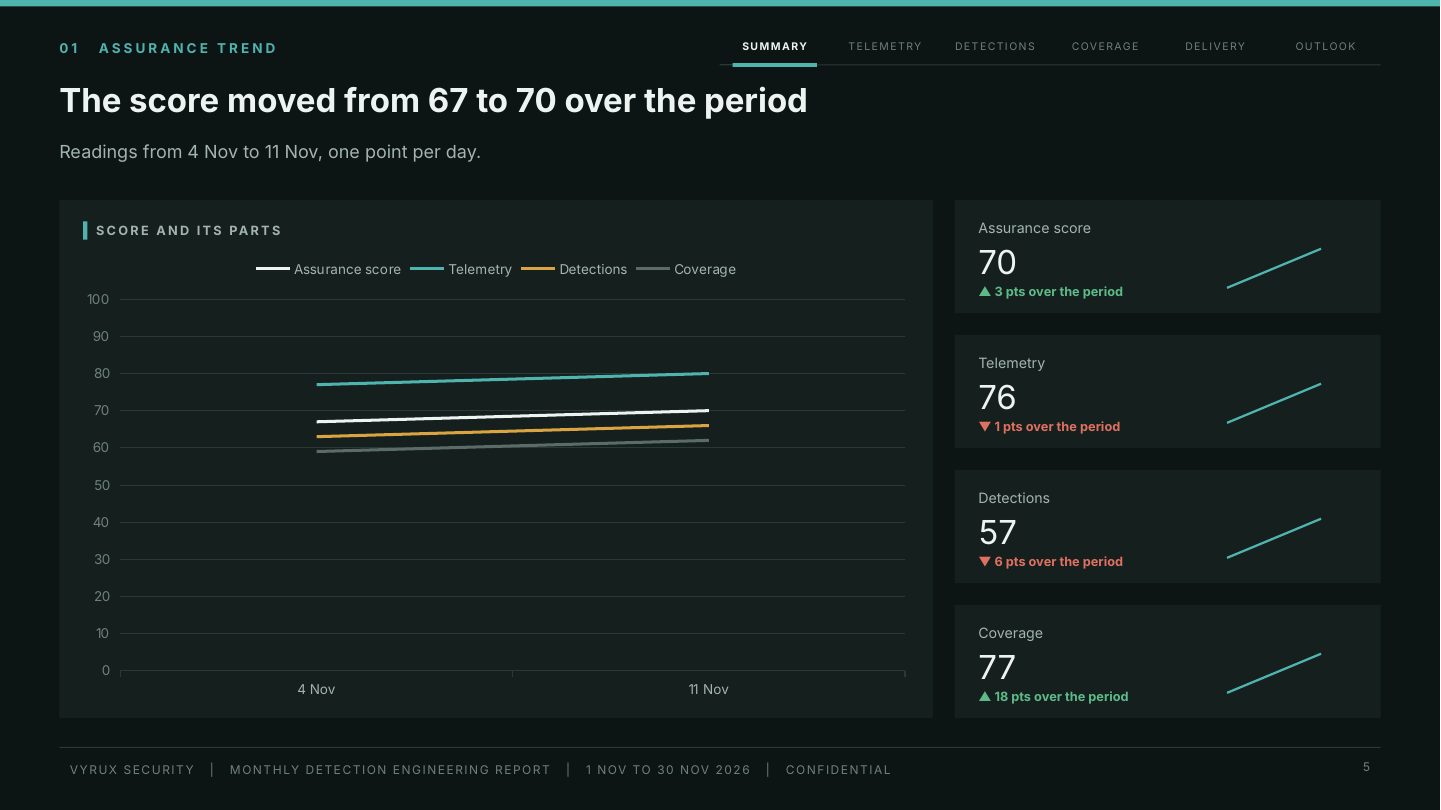
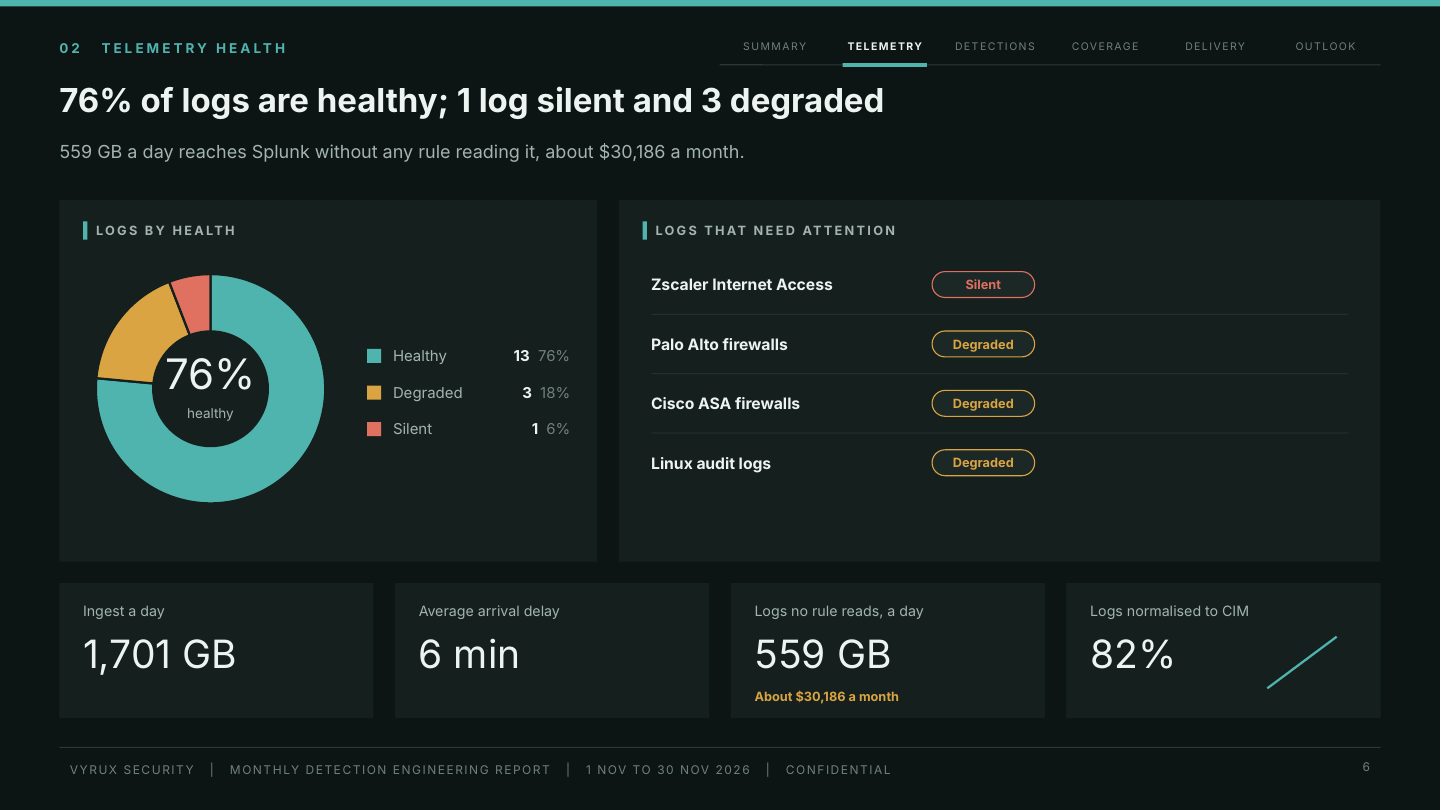
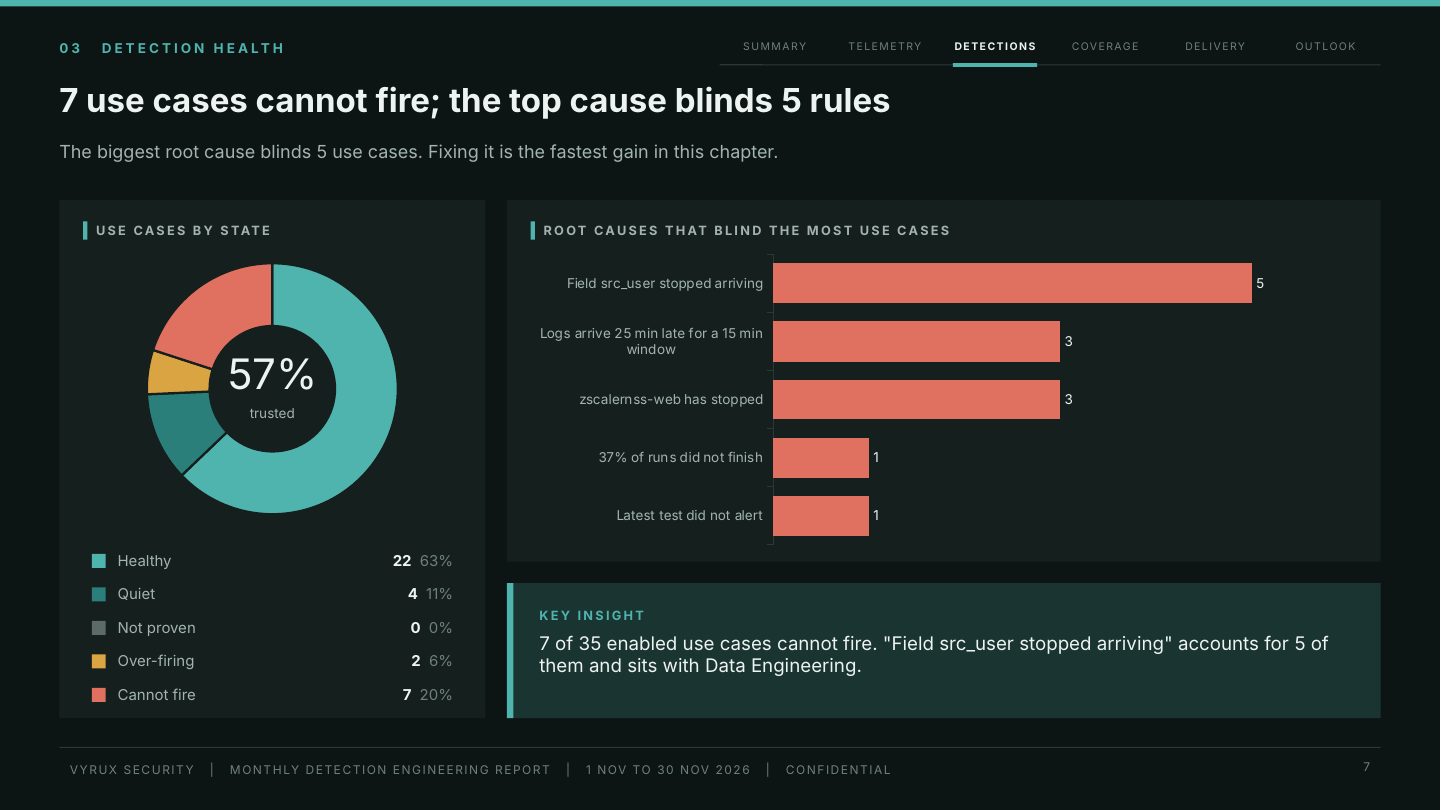
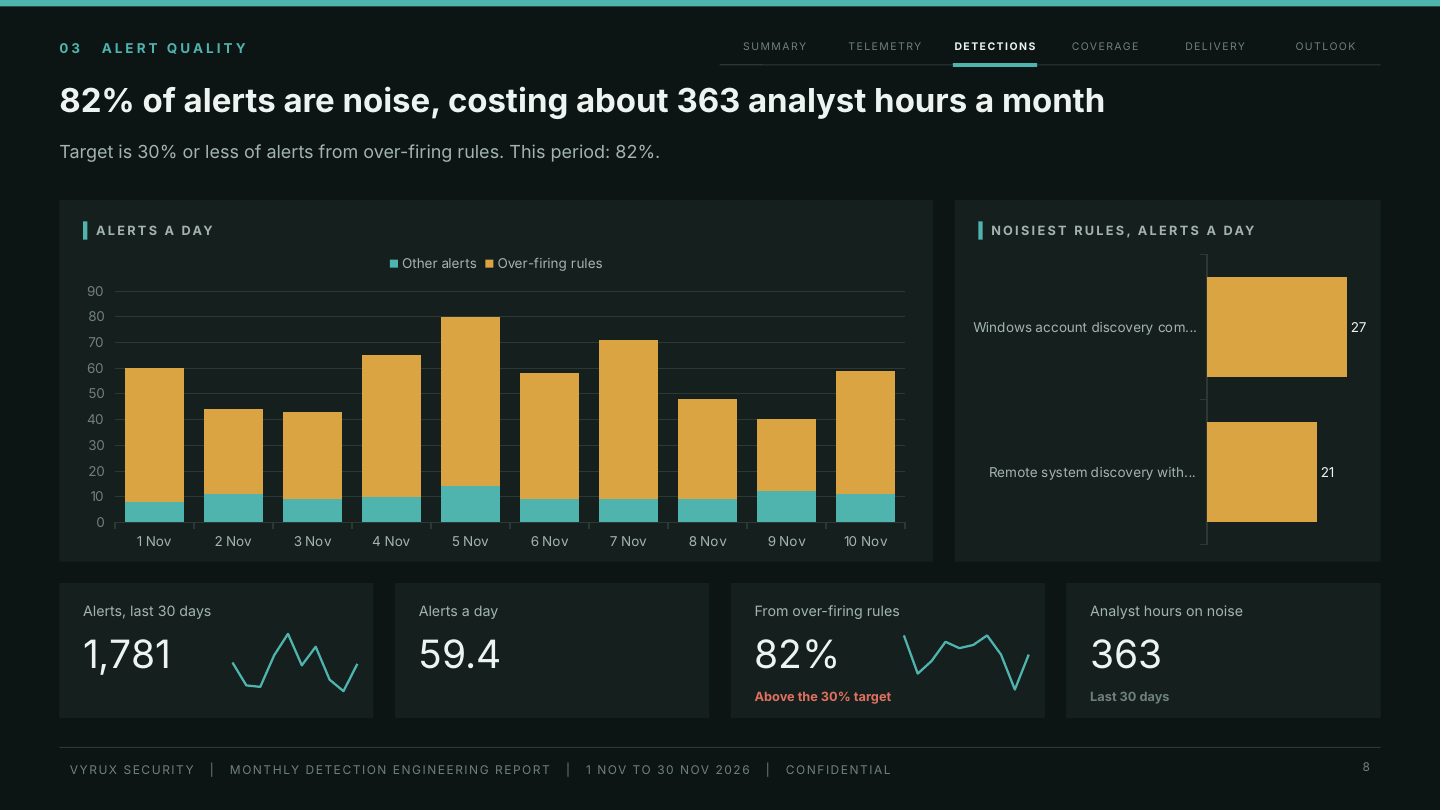
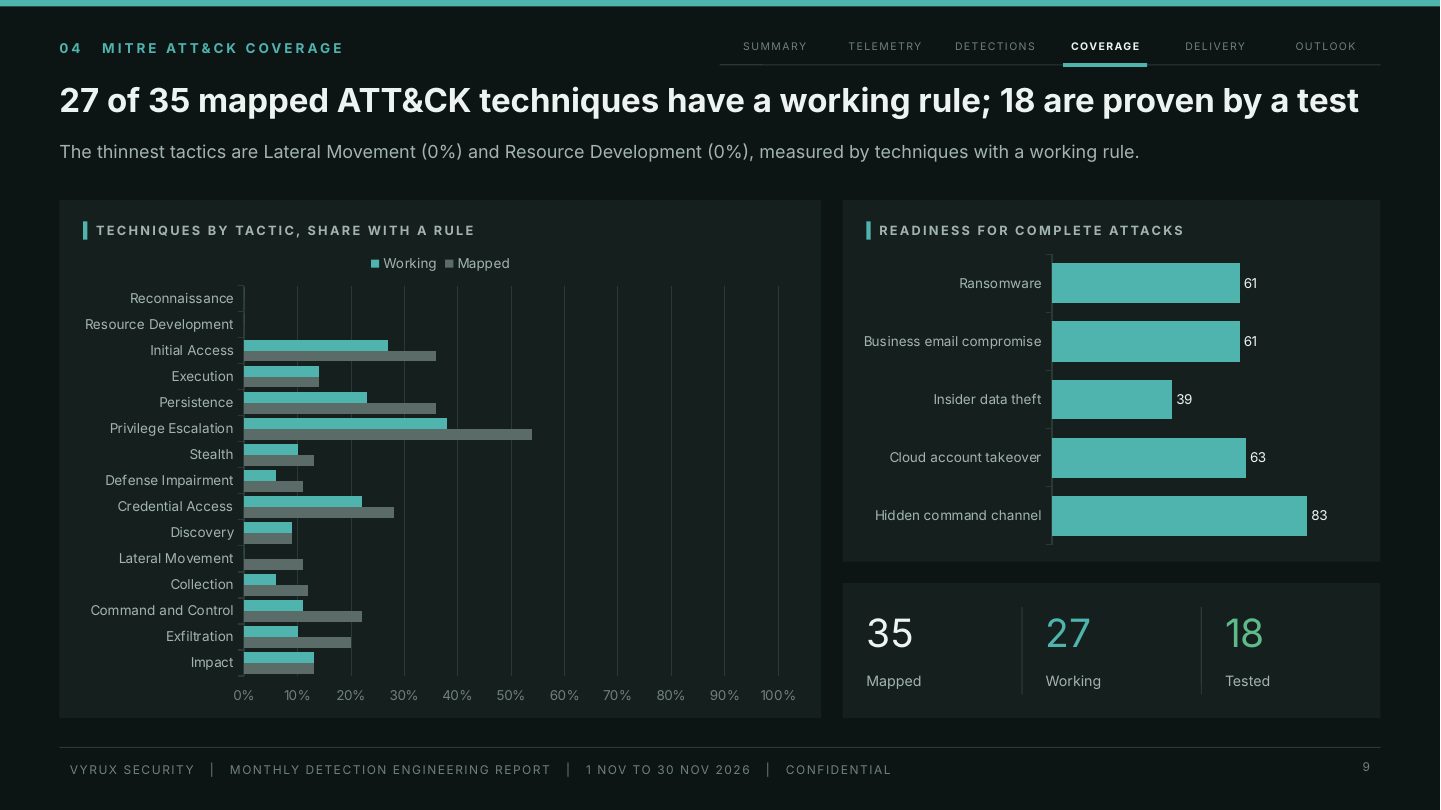
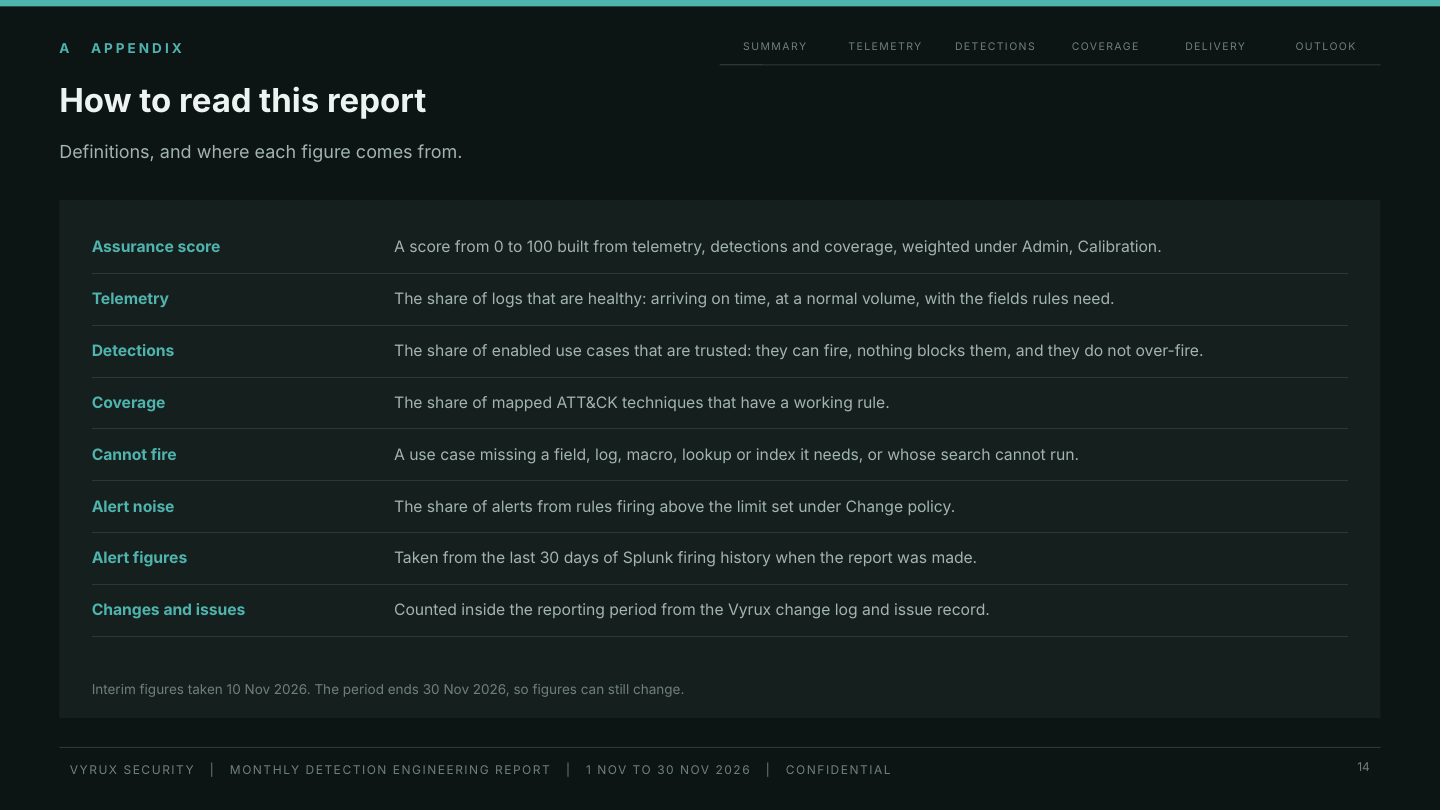
Fifteen slides on one grid, so every panel lines up from slide to slide. Each slide opens with its message as the title and one line on why it matters, and a tracker at the top shows which chapter you are in: cover, contents, executive summary, scorecard against targets, assurance trend, telemetry health, detection health, alert quality, MITRE ATT&CK coverage, engineering delivery, mean times, value delivered, priorities for the next period, definitions, and a closing slide with the disclaimer and copyright. Charts are native PowerPoint charts, so they can be restyled or copied into your own slides.