Command Center
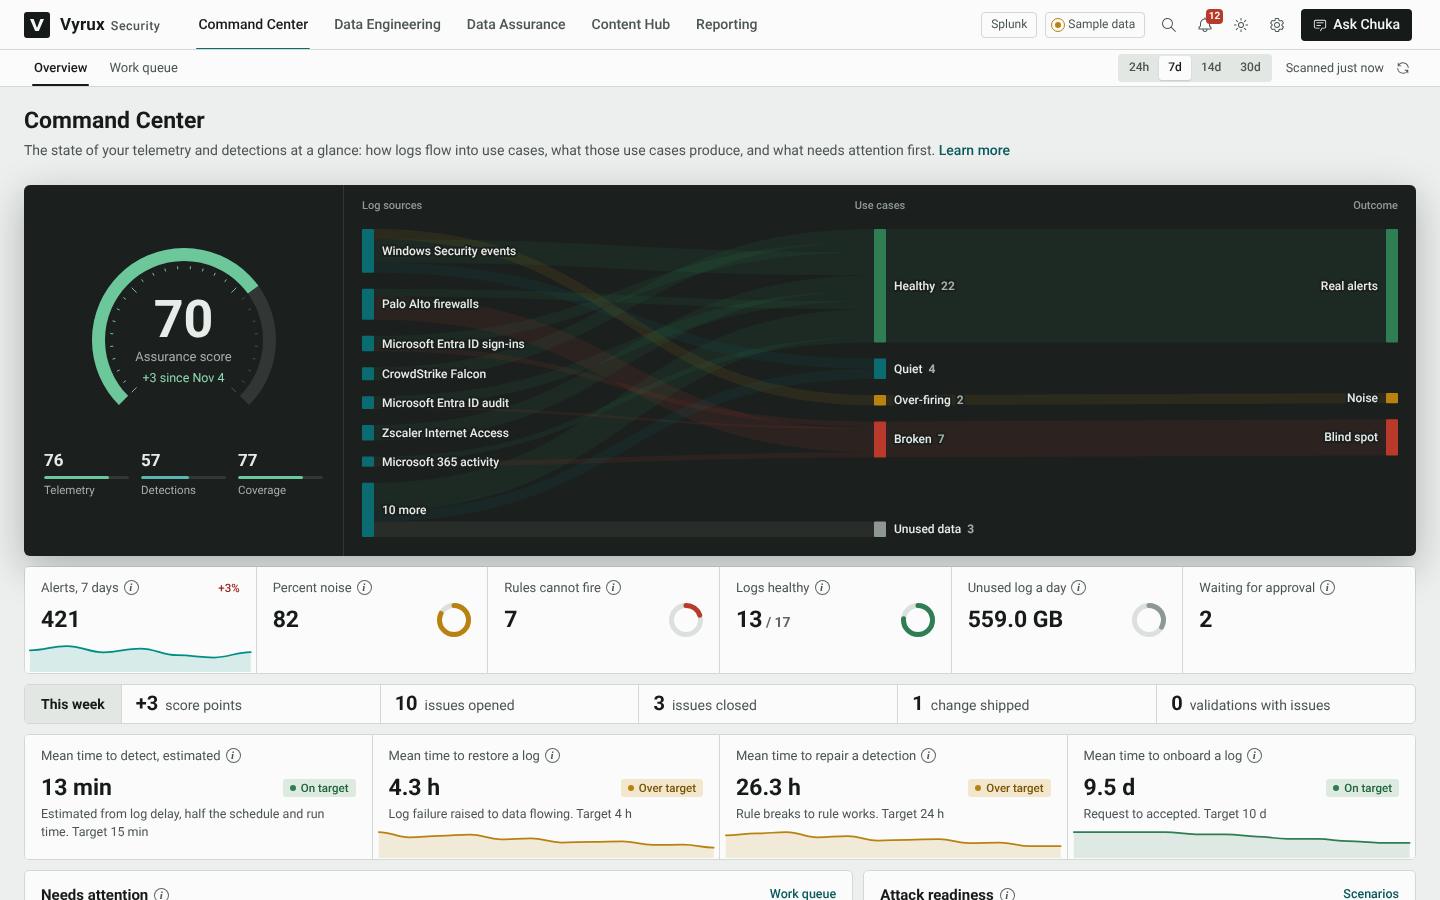
The first page you see. It answers one question: can we trust our detections today?
The assurance score
One number from 0 to 100, built from three parts: Telemetry (are the logs healthy), Detections (can the use cases fire and be trusted) and Coverage (how much of MITRE ATT&CK has a working rule). You can change the weights under Admin, Calibration.
The flow
The diagram follows your data from left to right: log sources by index, the use cases that read them, and what those use cases produce. Green ends in Real alerts. Amber ends in Noise. Red ends in a Blind spot: a rule that cannot fire. Click any band to open the list behind it.
Needs attention and attack readiness
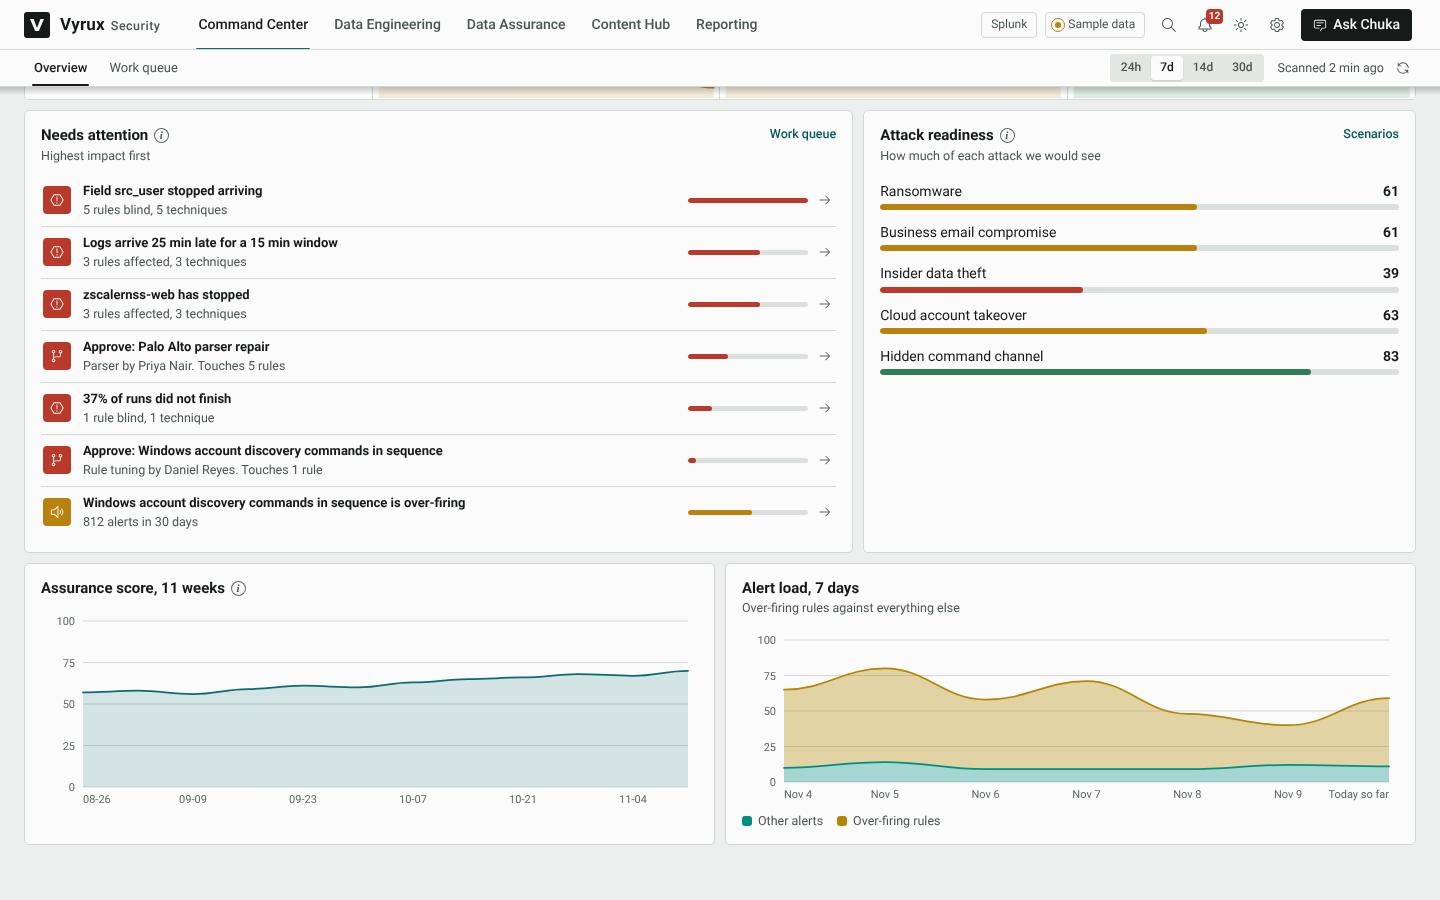
Lower down, Needs attention lists the root causes that affect the most use cases, and Attack readiness shows how much of each common attack you would see. The trend charts show the score and alert load over time.